

Designing Observability and SLOs
An observability system connects a user's result to the work that produced it. It should help an operator answer three questions: is the service meeting its promise, which part failed, and did the repair work?
Without observability, operating a distributed system is like flying a plane blindfolded. If the checkout button stops working, you need to know immediately, and you need data to tell you whether it's the payment gateway, the inventory database, or a network partition.
The Three Pillars of Observability
- Metrics: Aggregated numbers measured over time (e.g., requests per second, CPU usage, error rates). They are cheap to store and great for alerting. Tools: Prometheus, Datadog.
- Logs: Discrete events recording what happened (e.g., "User 123 failed authentication because password expired"). They are expensive to store in high volume but crucial for deep debugging. Tools: ELK stack (Elasticsearch, Logstash, Kibana).
- Traces: The lifecycle of a single request as it travels across multiple microservices. They show where the request spent its time. Tools: Jaeger, OpenTelemetry.
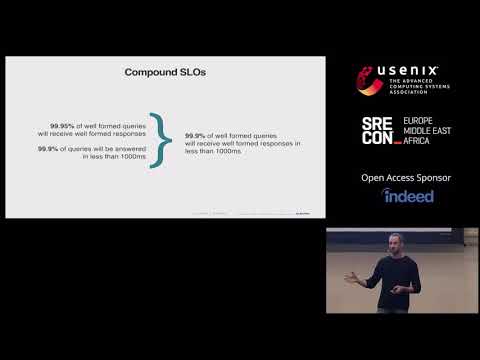
Service Level Objectives (SLOs)
Metrics don't mean anything without targets. We define:
- SLI (Service Level Indicator): A carefully defined quantitative measure. Example: The proportion of HTTP GET requests to
/api/cartthat return HTTP 200 within 200ms. - SLO (Service Level Objective): A target value for the SLI. Example: 99.9% of requests over a rolling 30-day window must meet the SLI.
- SLA (Service Level Agreement): An explicit contract with consequences (usually financial) if the SLO is not met.
Error Budgets
If an availability SLO is 99.9% over a 30-day window, the remaining 0.1% is about 43.2 minutes of unsuccessful eligible time. Event-based SLIs budget failed events rather than literal downtime.
An error-budget policy aligns product and operations on what to do when burn is excessive. Slowing risky launches is common, but freezing every release is not inherent to the metric; urgent security and reliability repairs may need to continue.
Architecture of a Monitoring System
A typical monitoring pipeline using Prometheus looks like this:
Applications instrument their code to maintain counters in memory. The Prometheus server "scrapes" (pulls) these metrics periodically. It evaluates recording rules and alerts. If an alert condition is met (for SLO-based alerting, e.g., the error budget burning 14.4x faster than sustainable over both the last hour and the last 5 minutes), it fires a webhook to an alerting service to wake up an on-call engineer.
Worked example: SLOs for a checkout service
| SLI | Measured at | Good event | SLO (28 days) | Budget |
|---|---|---|---|---|
| Availability | Load balancer logs | Response not 5xx, excluding client aborts | 99.9% | About 40 min of full outage, or 0.1% of requests |
| Latency | Load balancer histogram | Completed in under 400 ms | 99% of requests | 1% of requests may be slower |
| Correctness | Async order-audit job | Order total matches the recomputed total | 99.99% | 1 in 10,000 orders |
With 2 million checkouts in 28 days, the availability budget is 2,000 failed requests. A bad deploy that fails 5% of requests for 20 minutes, at about 50 requests per minute, uses about 50 of them, or 2.5% of the budget. A 1-hour 1.44% error ratio (a 14.4x burn) triggers the fast page.
Prometheus rules for the fast-burn page
Recording rules precompute error ratios over several windows, for example job:checkout_errors:ratio_rate5m and job:checkout_errors:ratio_rate1h, each defined as the rate of 5xx responses divided by the rate of all responses. The alert fires when both the 1-hour and the 5-minute ratios exceed 14.4 x 0.001. A slower ticket-level alert compares 6-hour and 30-minute windows against 6 x 0.001. Tools such as Sloth, Pyrra and OpenSLO generate these rules from a short SLO specification.
Sizing the metrics backend
- 1.2 million active series, scraped every 15 s, is 80,000 samples per second. Prometheus's compressed TSDB typically uses about 1 to 2 bytes per sample, so about 7 to 14 GB per day.
- Local Prometheus retention defaults to 15 days. Long-term storage and a global query view come from Thanos, Cortex or Mimir, backed by object storage.
- The biggest cost risk is cardinality. One label containing user IDs can multiply series by 100,000. Enforce limits on series per metric at ingestion.