
Back-of-the-envelope capacity planning
Capacity planning turns product assumptions into approximate request rates, storage, bandwidth, and operating cost. The estimate should expose likely bottlenecks and help choose what to measure next. Extra decimal places do not make uncertain inputs more reliable.
We will estimate a feed's read traffic, account for work hidden behind each request, and compare the shortener's storage allowance with a historical measurement.
Turn user activity into a rate
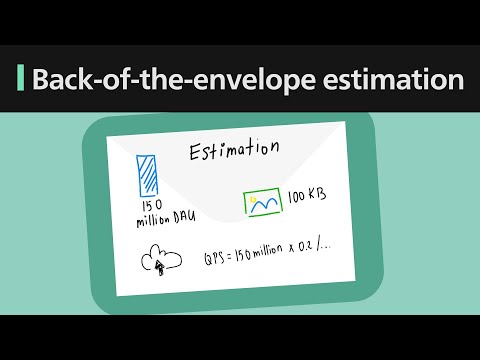
Start with active users and actions per user, not the total number of registered accounts. Suppose a feed has 10 million daily active users, each making 20 feed requests per day.
| Step | Calculation | Result |
|---|---|---|
| Daily reads | 10 million × 20 | 200 million requests |
| Average rate | 200 million ÷ 86,400 seconds | About 2,300 requests per second |
| Assumed busy period | Average × 10 | About 23,000 requests per second |
Record where the traffic arrives, how long bursts last, and whether one tenant or popular item concentrates the load. A global daily total does not describe the busiest region or partition. Revisit the estimate for growth, launches, and seasonal demand.
Count the work behind one request
A feed request might return 20 items. Fetching each item with a separate database query would produce roughly 460,000 lookups per second at the assumed peak, before retries or cache misses. That estimate is a reason to inspect batching and query shape; it does not by itself prove that any particular database cannot cope.
Separate reads, writes, background jobs, and fanout. One new post can cause many feed updates. One redirect in our shortener also writes an event, so a product with many more reads than creations is not necessarily read-heavy at the database.
Bandwidth needs bytes as well as requests. At an illustrative 20 kB response payload, 23,000 feed responses per second carry about 460 MB/s, or 3.7 Gbit/s, before protocol overhead. These decimal units describe payload leaving that serving boundary; compression, caches, and network placement change what each link carries.
Keep the latency target beside the rate. “Handles 23,000 requests per second” is not sufficient if the queue grows throughout the test and users wait longer each minute.
Build storage from retention and representation
For a steady write rate, start with:
Retained records = records per day × retention days.Multiply by the stored bytes per record, then account for indexes, replicas, derived data, backups, write logs, and temporary space. Do not add an index allowance twice if your measured record size already includes it.
The shortener exercise assumes 1 million new links per day, retained for five 365-day years. That gives 1.825 billion links. An initial allowance of 500 bytes per link, including indexes, projects 0.9125 decimal TB for that one copy of the link data.
Click history is separate and may dominate. At 100 million redirects per day, the shortener records 100 times as many redirect events as new links. The event size and retention period need their own estimate.
Replace the assumptions that matter most
A local PostgreSQL 16.10 capture on 11 September 2026 measured a million-row shortener fixture. Its link table's main data fork occupied 93,085,696 bytes and its indexes 44,974,080 bytes: about 138.1 bytes per link together. That measure excludes auxiliary storage and the rest of the database.
Using the rounded 138.1 bytes in the same projection gives about 0.252 TB, roughly 3.6 times smaller than the initial link allowance. It remains a projection: longer URLs, extra indexes, growth, and deleted-row space can change the future representation. It is not the total disk requirement or a predicted invoice.
The same historical test completed 231,377 warm indexed lookups in 20 seconds at a target arrival rate of about 11,574 per second. None failed, were skipped, or exceeded its chosen one-second limit. It used a local socket and excluded the application and required event insert. It supports testing the simple design further; it does not establish capacity for the complete five-year service.
Finish the estimate by naming the next limiting resource: CPU, database writes, cache memory, queue processing, bandwidth, or a provider quota. Measure that path with representative data and failures. Cost-aware architecture then connects those quantities to the bill and the work of operating the system.
Back-of-the-envelope capacity planning
Capacity planning turns product assumptions into approximate request rates, storage, bandwidth, and operating cost. The estimate should expose likely bottlenecks and help choose what to measure next. Extra decimal places do not make uncertain inputs more reliable.
We will estimate a feed's read traffic, account for work hidden behind each request, and compare the shortener's storage allowance with a historical measurement.
Turn user activity into a rate
Start with active users and actions per user, not the total number of registered accounts. Suppose a feed has 10 million daily active users, each making 20 feed requests per day.
| Step | Calculation | Result |
|---|---|---|
| Daily reads | 10 million × 20 | 200 million requests |
| Average rate | 200 million ÷ 86,400 seconds | About 2,300 requests per second |
| Assumed busy period | Average × 10 | About 23,000 requests per second |
The tenfold peak is an assumption to replace with traffic evidence. If plausible peaks range from 20,000 to 50,000 requests per second, compare designs across that range. A design that works only at the rounded midpoint has little margin for uncertainty.
Record where the traffic arrives, how long bursts last, and whether one tenant or popular item concentrates the load. A global daily total does not describe the busiest region or partition. Revisit the estimate for growth, launches, and seasonal demand.
Count the work behind one request
A feed request might return 20 items. Fetching each item with a separate database query would produce roughly 460,000 lookups per second at the assumed peak, before retries or cache misses. That estimate is a reason to inspect batching and query shape; it does not by itself prove that any particular database cannot cope.
Separate reads, writes, background jobs, and fanout. One new post can cause many feed updates. One redirect in our shortener also writes an event, so a product with many more reads than creations is not necessarily read-heavy at the database.
Bandwidth needs bytes as well as requests. At an illustrative 20 kB response payload, 23,000 feed responses per second carry about 460 MB/s, or 3.7 Gbit/s, before protocol overhead. These decimal units describe payload leaving that serving boundary; compression, caches, and network placement change what each link carries.
Keep the latency target beside the rate. “Handles 23,000 requests per second” is not sufficient if the queue grows throughout the test and users wait longer each minute.
Build storage from retention and representation
For a steady write rate, start with:
Retained records = records per day × retention days.
Multiply by the stored bytes per record, then account for indexes, replicas, derived data, backups, write logs, and temporary space. Do not add an index allowance twice if your measured record size already includes it.
The shortener exercise assumes 1 million new links per day, retained for five 365-day years. That gives 1.825 billion links. An initial allowance of 500 bytes per link, including indexes, projects 0.9125 decimal TB for that one copy of the link data.
Click history is separate and may dominate. At 100 million redirects per day, the shortener records 100 times as many redirect events as new links. The event size and retention period need their own estimate.
Replace the assumptions that matter most
A local PostgreSQL 16.10 capture on 11 September 2026 measured a million-row shortener fixture. Its link table's main data fork occupied 93,085,696 bytes and its indexes 44,974,080 bytes: about 138.1 bytes per link together. That measure excludes auxiliary storage and the rest of the database.
Using the rounded 138.1 bytes in the same projection gives about 0.252 TB, roughly 3.6 times smaller than the initial link allowance. It remains a projection: longer URLs, extra indexes, growth, and deleted-row space can change the future representation. It is not the total disk requirement or a predicted invoice.
The same historical test completed 231,377 warm indexed lookups in 20 seconds at a target arrival rate of about 11,574 per second. None failed, were skipped, or exceeded its chosen one-second limit. It used a local socket and excluded the application and required event insert. It supports testing the simple design further; it does not establish capacity for the complete five-year service.
Finish the estimate by naming the next limiting resource: CPU, database writes, cache memory, queue processing, bandwidth, or a provider quota. Measure that path with representative data and failures. Cost-aware architecture then connects those quantities to the bill and the work of operating the system.