
Estimating Frequencies with Count-Min Sketch
If you need to know how many times a specific user has visited a site (frequency), keeping a hash map of UserID -> Count works until you hit millions of users, at which point memory becomes a bottleneck.
How Count-Min Sketch Works
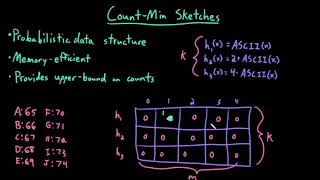
The Count-Min Sketch is a probabilistic data structure used to estimate the frequency of events. It is essentially a 2D matrix of counters and a set of independent hash functions.
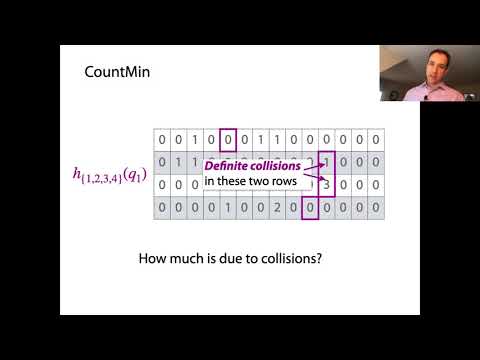
When an item arrives, you hash it using each hash function. The results correspond to column indices. You increment the counter in each corresponding row. To query the frequency of an item, you hash it again, look at the values in the corresponding cells, and take the minimum value.
Overcounting, Never Undercounting
Because multiple items might hash to the same cell, a cell can include mass from other items. Taking the minimum mitigates that error. With non-negative updates, no counter overflow, and consistent hashes, the standard estimate does not fall below the true processed frequency; signed updates, overflow, decay, or incompatible merges require different guarantees. Width controls additive error, while depth controls failure probability.
It is heavily used in NLP (counting word frequencies), networking (tracking heavy traffic flows), and recommendation engines where perfect frequency accuracy isn't required but memory is strictly constrained.
Worked example: sizing from error targets
Target: overcount at most 0.1 percent of the stream (epsilon = 0.001) with 99 percent confidence (delta = 0.01).
| Parameter | Formula | Value |
|---|---|---|
| Width w | ceil(e divided by epsilon) | 2,719 |
| Depth d | ceil(ln(1 divided by delta)) | 5 |
| Counters | w x d | 13,595 |
| Memory at 4 bytes per counter | about 54 KB |
Guarantee: for every item, estimate is at least the true count, and with probability at least 99 percent it is at most true count plus epsilon x N, where N is the total number of events.
With N = 100 million events, epsilon x N = 100,000. An item that truly occurred 5 million times is estimated within 2 percent. An item that occurred 50 times could be reported as anything up to about 100,050. That is why Count-Min is great for heavy hitters and useless for the long tail.
A tiny example
Width 4, depth 2. Insert "a" (row 1 col 0, row 2 col 3), "b" (row 1 col 0, row 2 col 1), "a" again. Row 1 col 0 now holds 3 (a, b, a); row 2 col 3 holds 2. Query "a": minimum of 3 and 2 is 2, correct, because row 2 had no collision.
Variants and alternatives
| Structure | Strength | Weakness |
|---|---|---|
| Count-Min | Simple, mergeable by adding counters | Overestimates; error scales with total N |
| Count-Min with conservative update | Much lower overcount: only raise counters that equal the current minimum | No longer mergeable by simple addition in all cases; no deletes |
| Count sketch | Unbiased, error scales with L2 norm, better for skewed data | Can under- or overestimate; uses median |
| Exact hash map | Exact | Memory grows with distinct keys |
In the wild: Redis Stack exposes CMS.INCRBY and CMS.QUERY; network devices use Count-Min style sketches to find heavy flows; the Caffeine cache's TinyLFU admission policy uses a compact frequency sketch with periodic halving so old popularity decays.