

The Three Pillars: Metrics, Logs, and Distributed Tracing
In distributed microservices, inspecting a single server's logs is insufficient to debug intermittent errors or latency spikes. Observability answers why a system is misbehaving by synthesizing three complementary telemetry signals:
- Metrics (Aggregated Numbers): Time-series counters, gauges, and histograms (via Prometheus). Extremely cheap to store, ideal for alerting and dashboards.
- Logs (Detailed Events): Structured JSON records of distinct occurrences (via Elasticsearch / Loki). Essential for forensic analysis of specific errors.
- Distributed Tracing (Request Context): Propagates a unique
trace_idand parentspan_idacross network boundaries (via OpenTelemetry / Jaeger), reconstructing the end-to-end execution timeline across dozens of microservices.
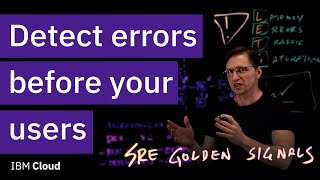
The Four Golden Signals
Google's SRE framework defines the four critical health metrics for any production service: Latency (time to service a request), Traffic (QPS / demand), Errors (rate of failed requests), and Saturation (how constrained the most constrained resource is, e.g., memory or thread pool capacity).
Worked example: sizing telemetry for one service fleet
Suppose a checkout API handles 10,000 requests per second and each request touches 8 services, producing about 20 spans of roughly 500 bytes each.
- Traces at 100% sampling: 10,000 x 20 x 500 B = 100 MB/s, or about 8.6 TB per day. Few teams keep this.
- Head sampling at 1%: about 86 GB per day, but the one slow request in ten thousand is likely to be dropped.
- Tail sampling: a collector buffers each trace for a few seconds, then keeps every trace with an error or with latency above p99, plus a 1% baseline. The volume stays small and the traces you keep are the ones you would want to look at.
- Metrics: a latency histogram with 12 buckets, labelled by
endpoint(40),status_class(5) andregion(3), is 40 x 5 x 3 x 12 = 7,200 series. Addingcustomer_idwith 200,000 values would multiply that to about 1.4 billion series. This is why identifiers go in logs and traces rather than in metric labels.
Choosing the right signal
| Signal | Best question it answers | Cost driver | Typical tools |
|---|---|---|---|
| Metrics | Is the service healthy right now, and is it getting worse? | Number of unique label combinations (cardinality) | Prometheus, Mimir, Datadog, CloudWatch |
| Logs | What exactly happened to this request or user? | Bytes ingested and indexed | Loki, Elasticsearch/OpenSearch, Splunk |
| Traces | Which hop added the latency or produced the error? | Spans kept after sampling | OpenTelemetry, Jaeger, Tempo, Honeycomb |
| Profiles | Which function is burning CPU or memory? | Sampling frequency | pprof, Pyroscope, Parca |
How the signals connect during an incident
The links in that chain are exemplars (a trace ID attached to a histogram sample) and a trace_id field in every log line. Without them an engineer has to line up timestamps across tools by hand.
Failure modes to design for
- The monitoring system goes down with the thing it monitors. Keep alerting on independent infrastructure, and add a "dead man's switch" alert that fires if the metrics pipeline stops reporting.
- Clock skew. Spans from hosts with drifting clocks can appear to start before their parent. Trace UIs fix this up using parent-child relationships, but rely on NTP or PTP anyway.
- Log storms. A failing dependency can multiply log volume tenfold within minutes. Rate-limit or sample repetitive error logs at the agent.
In practice, Google's Dapper paper (2010) established low-rate sampled tracing with propagated context. OpenTelemetry now standardises the APIs and the W3C traceparent header so that traces cross language and vendor boundaries.